
ဝှာင်:Temperature Bar Chart Africa--1901-2020--2021-07-14.png
ဇမၞော် နမူနာ ဏအ် - ၈၀၀ × ၄၅၀ pixels အရာမသ္ဂုတ်သွာတ်လဝ်ဂမၠိုၚ်: ၃၂၀ × ၁၈၀ pixels | ၆၄၀ × ၃၆၀ pixels | ၁၀၂၄ × ၅၇၆ pixels | ၁၂၈၀ × ၇၂၀ pixels | ၂၅၆၀ × ၁၄၄၀ pixels | ၃၇၈၀ × ၂၁၂၆ pixels တၞဟ်။
ဝှာင် တမ်မူလ (၃၇၈၀ × ၂၁၂၆ pixels, file size: ၅၉ KB, MIME type: image/png)
သကေမ်
| ကဵုယၟု |
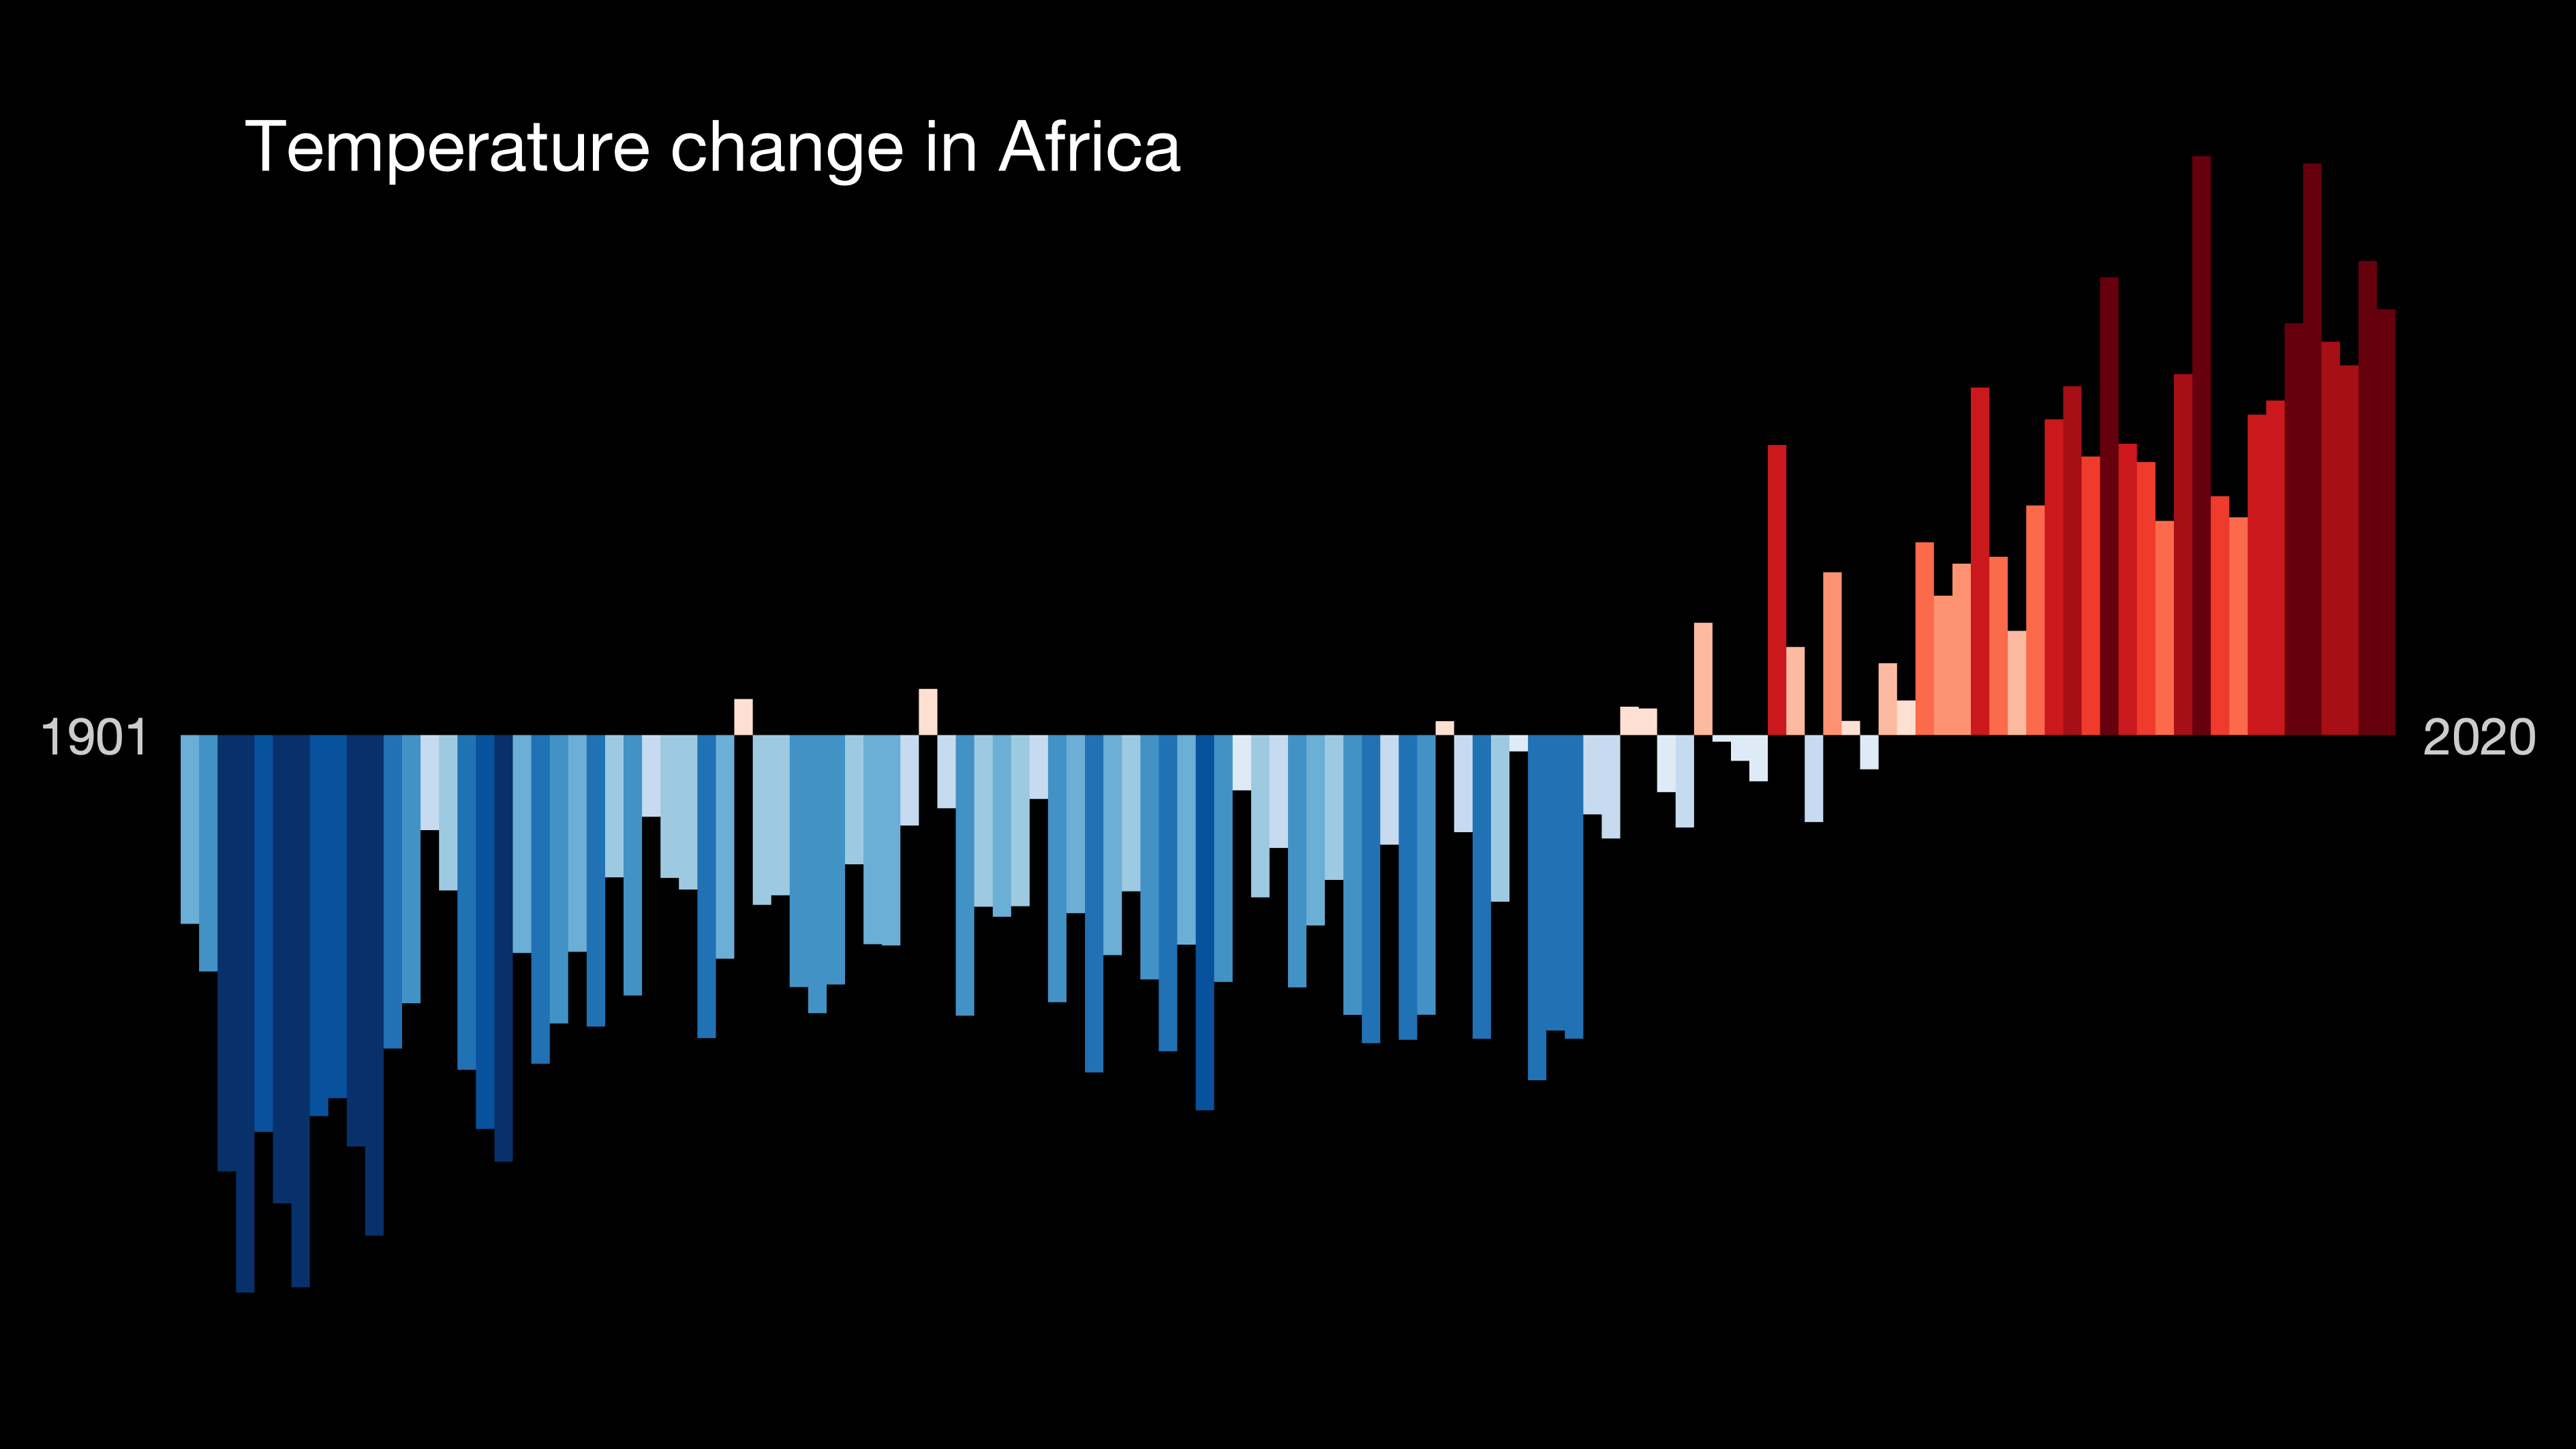
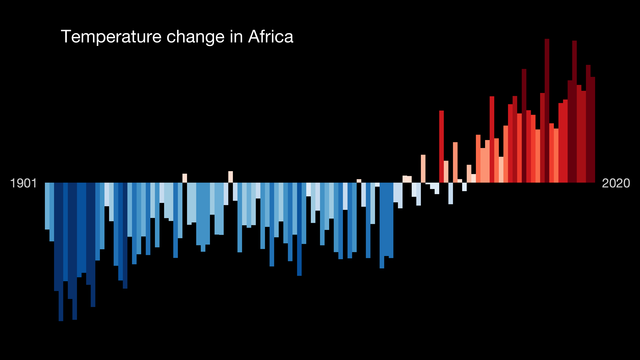
English: This bar chart is a visual representation of the change in temperature in the past 100+ years. Each stripe represents the temperature averaged over a year. The average temperature in 1971–2000 is set as the boundary between blue and red colors, and the color scale varies from ±2.6 standard deviations of the annual average temperatures between the years mentioned in the file name. Data source: Berkeley Earth. For more information visit https://showyourstripes.info/faq
Français : Graphique à barres, décrivant visuellement le changement de température durant un siècle : Chaque bande représente la température moyenne sur une année. La température moyenne de 1971 à 2000 est définie comme la limite entre les couleurs bleue et rouge, et l'échelle de couleurs varie de ± 2,6 écarts-types des températures moyennes annuelles entre les années (mentionnées dans le nom du fichier). Source : Berkeley Earth / https://showyourstripes.info/faq |
| စၟတ်တ္ၚဲ | |
| တမ်ရိုဟ် | https://showyourstripes.info/ |
| ကဝိ | Ed Hawkins, University of Reading |
မသ္ဂုတ်သွာတ်လာင်ဇြေန်
ဤဖိုင်သည် Creative Commons Attribution 4.0 နိုင်ငံတကာ လိုင်စင်အောက်တွင် လိုင်စင်သတ်မှတ်ထားပါသည်။
- မၞးဂှ် ဗွဲမဗၠးၜး -
- သွက်ဂွံ ပါ်ပရအ် – သွက်ဂွံ စၠောအ်ပပ်ပဳ၊ တြးပတိတ်၊ ဗလး ကမၠောန်
- သွက်ဂွံ ပကောံနှဴ – သွက်ဂွံ ပလေဝ်ပညဳ ကမၠောန်
- နကဵု တင်မသ္ဒးဒ္ဂေတ်ဗက် ဗွဲသၟဝ်ဏအ်ဂှ်
- တင်မစှ်ေစိုတ် – မၞး သ္ဒးဒ္ဂေတ်ဗက် သၞောတ်ဝ် မဖျေဟ်လဝ် စပ်ကဵု အစာချူလိက် ဟွံသေင်မ္ဂး တၠမူတအ်ရောင်၊၊ (ဆဂး နကဵုနဲလဵု အကာဲအရာ ဗီုလဵုလေဝ် ဟွံကဵုကသပ် ဟွံထံက်ဂလာန် ကုမၞး ပ္ဍဲအရာမစကာ ဒြပ်ညးတၞဟ်တအ်ရောင်)။
ဝှာင် လၟေင်အပြံင်အလှာဲ
ဍဵု လတူ စၟတ်တ္ၚဲ/အခိင် မွဲမွဲ သွက်ဂွံ ထ္ၜးကဵု ဝှာင် မကတဵုဒှ်လဝ် ပ္ဍဲအခိင်ဂှ်၊၊
| စၟတ်တ္ၚဲ/အခိင် | ဗီုပြင်နမူနာ | ပမာဏ | ညးလွပ် | တင်ပသောင်ကလး | |
|---|---|---|---|---|---|
| လၟုဟ် | ၁၅:၁၂၊ ၁၄ ဂျူလာင် ၂၀၂၁ | | ၃၇၈၀ × ၂၁၂၆ (၅၉ KB) | DiagramLover | Uploaded a work by Ed Hawkins, University of Reading from https://showyourstripes.info/ with UploadWizard |
ဝှာင် ဗီုဂွံစကာ
မုက်လိက် မရပ်စပ် ဝှာင်ဏအ် ဟွံမဲ၊၊
ဝှာင် သွက်ဂွံသုင်စောဲ ဂလုပ်ဗဴ
ဗွဲသၟဝ်ဏအ်ဂှ် ဒှ်အရာ ဝဳကဳတၞဟ် မစကာလဝ် ဝှာင်ဏအ်၊၊
- ဗီုစကာ ပ္ဍဲ af.wikipedia.org
- ဗီုစကာ ပ္ဍဲ en.wikipedia.org
- ဗီုစကာ ပ္ဍဲ fr.wikipedia.org
- ဗီုစကာ ပ္ဍဲ hy.wikipedia.org
- ဗီုစကာ ပ္ဍဲ sl.wikipedia.org
- ဗီုစကာ ပ္ဍဲ sr.wikipedia.org
- ဗီုစကာ ပ္ဍဲ zh.wikipedia.org